
Weekly Austin Real Estate Market Update
Austin Real Estate Weekly Market Update – July 17, 2025
by: Dan Price, Broker at Team Price Real Estate
Austin's leading data analysis brokerage, where data drives exceptional service
Published on: Thursday, July 17, 2025 at 05:44 am
Austin’s Real Estate Market: Inventory Rises, Buyer Power Grows: Austin Market Adjusts to New Norm
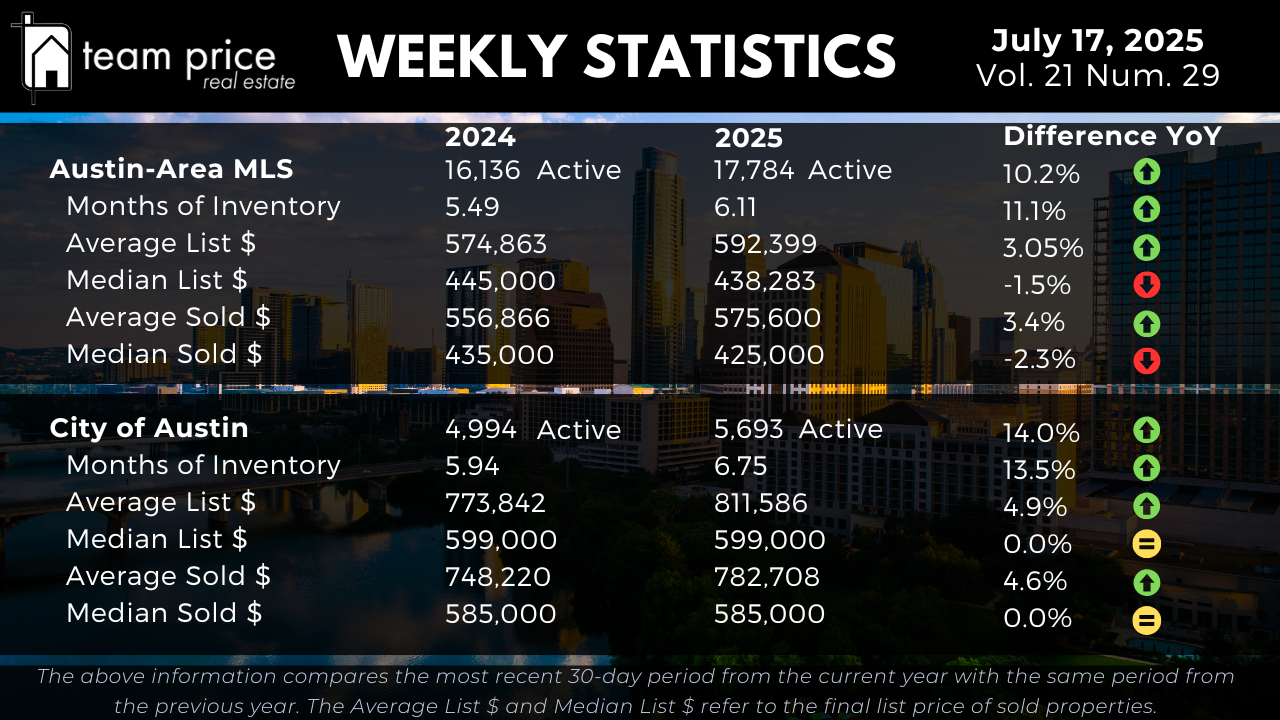
The Austin-area housing market continues its shift toward a buyer's market, with active residential listings up 10.2% year over year to 17,784 and Months of Inventory rising to 6.11—a clear signal that buyer leverage is growing. Despite this added supply, the average sold price has increased 3.4% to $575,600, while the median sold price has declined 2.3% to $425,000, indicating that upper-tier sales are propping up averages while affordability pressures weigh on the broader market. Nearly 69% of homes are now selling below asking price, and pricing power continues to shift in favor of buyers.
In the City of Austin, inventory growth is even more pronounced, up 14% from last year with 5,693 active listings and a 6.75 Months of Inventory level. Prices in the city are largely flat year over year, with the median sold price holding at $585,000 and the average sold price rising 4.6% to $782,708. However, from peak levels in 2022, both the city and broader region remain well below previous highs, confirming a long-term correction. Buyers are benefiting from more selection and softer pricing, while sellers must adapt to longer timelines and increased negotiation pressure.
Austin Real Estate Market Overview
Inventory levels across the Austin-Area MLS continue to climb, signaling that the market remains in a prolonged adjustment phase. As of this week, active residential listings total 17,784, up 10.2% year over year. Months of Inventory has expanded from 5.49 to 6.11, an 11.1% increase, indicating that supply is outpacing buyer demand. In the City of Austin, the trend is even more pronounced: listings have jumped 14.0%, reaching 5,693 homes, while Months of Inventory has climbed from 5.94 to 6.75, a 13.5% increase. This sustained inventory growth continues to tilt market conditions in favor of buyers, offering more negotiating power and longer windows to make informed decisions.
Austin Housing Prices: Mixed Signals in a Cooling Market
Pricing data reveals a mixed picture, with modest gains in averages but continued pressure on the middle tier. Across the Austin-Area MLS, the average list price is now $592,399, up 3.05% year over year, while the median list price has declined 1.5% to $438,283. On the sales side, the average sold price has risen 3.4% to $575,600, while the median sold price has dropped 2.3% to $425,000. This widening gap between average and median values underscores a market where higher-end sales are sustaining averages, but overall affordability remains a headwind for the broader buyer pool.
Within the City of Austin, prices have held steady. The median sold price remains unchanged from last year at $585,000, and the median list price is flat at $599,000. Meanwhile, the average sold price rose 4.6% to $782,708, and the average list price increased 4.9% to $811,586. These gains are concentrated at the higher end, while the middle of the market continues to face more pricing pressure and slower absorption.
Regional Trends: Price Gains Narrow as Correction Deepens
The broader Central Texas region remains in correction territory. Of the 30 cities tracked, 14 (47%) showed month-over-month price increases, while 15 (50%) experienced declines. On a year-over-year basis, 40% of cities posted gains and 60% declined. Importantly, none of these cities have surpassed their peak values from the past 12 months, reinforcing that while some stabilization is occurring, most areas remain in a downward pricing cycle.
At the ZIP code level, 43 of 75 (57%) showed monthly price gains, while 30 (40%) posted monthly losses. Year over year, 47% of ZIP codes are up, and 53% are down. Only 2 ZIP codes have exceeded their price peak from the past year, confirming that most submarkets remain in a rebalancing phase, well below their highs.
List-to-Sale Price Performance: Buyer Leverage Grows Amid Softer Closings
Pricing negotiation continues to define the current market cycle. So far this month, 68.5% of homes have sold below asking price, up from 65.89% last month. 18.8% of properties sold exactly at list price, and 12.7% closed over asking—down slightly from 13.22% this time last year. The average sold-to-list price ratio now sits at 97.18%, reinforcing that sellers are routinely conceding on price. For sellers, precision pricing and strong presentation remain essential, while buyers are capitalizing on expanded inventory and pricing flexibility.
Peak Value Trends: Market Recovery Still Trails 2022 Highs
Although current prices are holding relatively steady month to month, they remain well below historic peaks. In the Austin-Area MLS, the average list price peaked at $713,539 in April 2025 and now stands at $618,376—a 13.3% decline. The median list price is down 14.4% from its May 2022 peak of $539,900, now at $462,000. The average sold price has dropped 10.8% from its May 2022 high, and the median sold price is down 18.4%, from $538,000 to $438,933. Price per square foot metrics show deeper corrections: average is down 18.8%, and median is down 23.2%.
The City of Austin reflects similar declines. The average list price has fallen 14.5% from its April 2025 high of $947,871 to $810,055, and the median list price is down 12.4%, from $659,000 to $577,500. The average sold price is off 9.1% from peak, and the median sold price is down 13.5%, from $680,000 to $588,500. Both average and median price per square foot have fallen by approximately 20%, highlighting the depth of the correction from the market’s highs.
Austin Area Residential Sales Insights
Top Austin Real Estate Housing Questions
1. Is Austin a buyer’s market or seller’s market in 2025?
Answer: Overall, Austin and its metro area are currently in a neutral-to-buyer market, but it varies by location and price band. Inventory is up ~10% in the Austin-Area MLS and ~14% in the city itself, pushing Months of Inventory above 6 months—a threshold where buyers gain leverage. Some desirable suburban areas remain competitive (seller’s market), whereas many central city ZIP codes have softer conditions with slower absorption and increased listing cuts.
2. Why are home prices declining in Austin right now?
Answer: The combination of rising supply, elevated mortgage rates, and softening demand is putting downward pressure on prices. Median and average sold prices in the metro are down ~2–6% year-over-year—even steeper in peak markets like North and Downtown Austin. Nearly 45% of listings have price cuts, and the absorption rate is less than half the national average .
3. How much leverage do buyers have today?
Answer: Buyers have significantly more power now. As of July, 68.5% of homes sold under list price and only 12.7% sold above ask. The average sold-to-list ratio sits around 97%. These numbers reflect a shift from seller-driven conditions to buyer-favorable negotiation, especially in mid- and entry-tier segments .
4. Is this just a short-term dip or part of a lasting correction?
Answer: Data indicates a lasting correction rather than a brief slow-down. Most ZIP codes (73 of 75) remain below prior 12-month peaks. In the wider metro, no city has outperformed its recent peak. Price-per-square-foot metrics are down 19–23%, and market stability is returning—though prices are unlikely to crash—signaling a deeper revaluation phase .
5. What should first-time buyers do in this market?
Answer: Despite affordability challenges, first-time buyers can take advantage of rising inventory and lower competition. It's smart to explore down-payment assistance, lock in rates early, and work with agents focused on hyperlocal data. Gen Z and new buyers are leaning towards renting, but those ready to buy now can find value while others wait .
